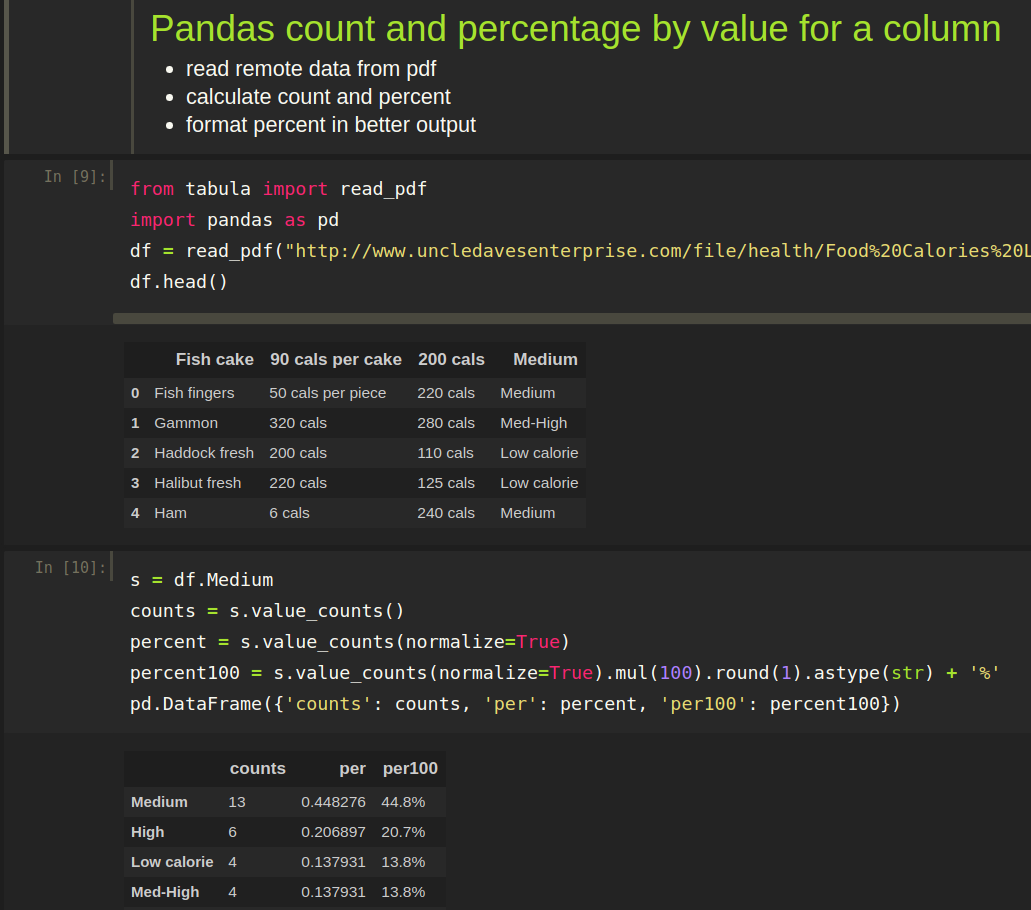


This is the simplest way to get the count, percenrage ( also from 0 to 100 ) at once with pandas. Let have this data:
| food | Portion size | per 100 grams | energy | |
|---|---|---|---|---|
| 0 | Fish cake | 90 cals per cake | 200 cals | Medium |
| 1 | Fish fingers | 50 cals per piece | 220 cals | Medium |
| 2 | Gammon | 320 cals | 280 cals | Med-High |
| 3 | Haddock fresh | 200 cals | 110 cals | Low calorie |
| 4 | Halibut fresh | 220 cals | 125 cals | Low calorie |
and we want to find how many items there are per energy:
| counts | per | per100 | |
|---|---|---|---|
| Medium | 14 | 0.466667 | 46.7% |
| High | 6 | 0.200000 | 20.0% |
| Med-High | 4 | 0.133333 | 13.3% |
| Low calorie | 4 | 0.133333 | 13.3% |
| Low- Med | 1 | 0.033333 | 3.3% |
| Low-Med | 1 | 0.033333 | 3.3% |
This sample code will give you:
- counts for each value in the column
- percentage of occurrences for each value
- pecentange format from 0 to 100 and adding % sign
First we are going to read external data as pdf:
from tabula import read_pdf
import pandas as pd
df = read_pdf("http://www.uncledavesenterprise.com/file/health/Food%20Calories%20List.pdf", pages=3, pandas_options={'header': None})
df.columns = ['food', 'Portion size ', 'per 100 grams', 'energy']
df.head()
Then we are going to calculate the count and percent:
s = df.keywords
counts = s.value_counts()
percent = s.value_counts(normalize=True)
percent100 = s.value_counts(normalize=True).mul(100).round(1).astype(str) + '%'
pd.DataFrame({'counts': counts, 'per': percent, 'per100': percent100})