


Debug is very important part of the programming process which is extremely easy and user friendly in Intellij. In this post we will cover 3 topics:
- Debug in IntelliJ/PyCharm
- Conditional breakpoints in IntelliJ/PyCharm
- Step back in IntelliJ/PyCharm
- References
Debug in IntelliJ/PyCharm
You need to know several things about debug in IntelliJ/PyCharm:
Start program in debug mode
You can run the current open script by: Debug Alt + Shift + F10
or run the last executed script by Debug 'Program1' Shift + F9
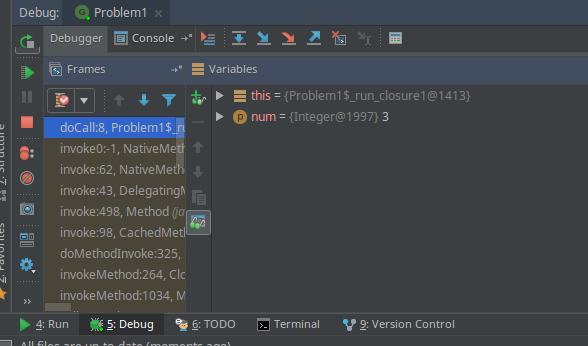
This will start debugging and if you have any enabled breakpoints which can be reached you program will stop at this breakpoint. New tab Debug will be open at the bottom with two sub-tabs: Debugger and Console
You have several option for debug:
- Step Over - F8 - pass over the current statement
- Step Into - F7 - enter into next piece of code
- Force Step Into - Alt + Shift + F7
- Step Out - Alt + F8
- Run to cursor - Alt + F9 - used to reach the next break point or the current position of the cursor
Another important parts of the debug are:
- Resume program - F9 - if you want to continue the program and stop with the debugging
- Stop 'program1' - Ctrl + F2 - stop current program
- View breakpoints - Ctrl + Shift + F8 - view all breakpoints and setup conditional breakpoints(or disable breakpoints)
- Mute breakpoints - Temporary disable breakpoints
You can see the variables - their types and values in tab Debugger. Changing to tab Console you can see the console output during debug mode.
Conditional breakpoints in IntelliJ/PyCharm
If you want to use conditional breakpoints(break points depending on some conditions) in IntelliJ you can do it by:
- Put the breakpoint - with left mouse click next to the line of code which is your target.
- Main menu
- Run
- View breakpoints - ( or by tab Debug - Ctrl + Shift + F8)
- Select your breakpoint
- Enable Condition
- Put your condition
For example lets have this piece of code:
for (int i = 2; i < 8; i++) {
...
}
You can put as conditional statement the following:
i == 5 in order to stop when the variable i has value 5.
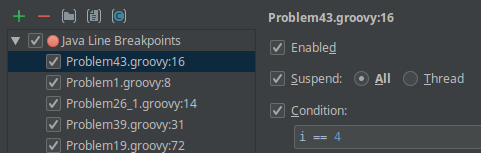
from this window you can:
- add breakpoints
- remove breakpoints
- enable breakpoints
- add conditional breakpoints
This kind of breakpoints are extremely useful when you want to check a specific condition or situation. For example you know that 100 iteration cause an error. Instead of manual debug and 100 times pressing Run to cursor you can put a conditional breakpoint. Another use case for conditional breakpoints is debugging recursion.
Step back in IntelliJ/PyCharm
You can do step back in some situations in IntelliJ. From the official documentation:
Interrupts execution and returns to the initial point of method execution. In the process, it drops the current method frames from the stack.
In other words you can step back method execution and rerun the execution of this method. For example the code:
public class Pyramid {
    public static void main(String[] args) {
        pyr(5);
        pyra(5);
        Set<Integer> iset = IntStream.rangeClosed(0, 5).boxed().collect(Collectors.toSet());
        System.out.println(iset);
    }

    public static void pyr(int n) {
        for (int i = 1; i <= 5; i++) {
            for (int j = 0; j < i; j++) {
                System.out.print("*");

            }

            //generate a new line
            System.out.println("");

        }
    }

    public static void pyra(int n) {
        IntStream.range(0, n + 1).forEach(
                k -> {System.out.println(new String(new char[k]).replace("\0", "*"));}
        );
    }
}
If we put the break point at the row:
pyr(5);
moving to the next row and stepping inside this method:
pyra(5);
Later we can drop the frames and re-executed this method from the beginning. So instead of this output:
*
**
***
****
*****

*
**
***
****
*****
[0, 1, 2, 3, 4, 5]
we get this one:
*
**
***
****
*****

*
**
***
****
*****

*
**
***
****
*****
[0, 1, 2, 3, 4, 5]