


Looking to create a Bar Plot per day of week based on dates in Pandas?
If so, I'll show you the steps to create a simple DataFrame with dates and plot bar chart per day of week.
Step 1: Create example Pandas DataFrame
To start, let's create simple DataFrame which has dates like:
data = {'productivity': [80, 20, 60, 30, 50, 55, 95],
        'salary': [3500, 1500, 2000, 1000, 2000, 1500, 4000],
        'age': [25, 30, 40, 35, 20, 40, 22],
        'duedate': ["2020-10-14", "2020-10-15","2020-10-15", "2020-10-17","2020-10-14","2020-10-14","2020-10-18"],
       }
data_ix = ['Tim', 'Jim', 'Kim', 'Bim', 'Dim', 'Sim', 'Lim']
df = pd.DataFrame(data, index=data_ix)
data:
| productivity | salary | person | duedate | |
|---|---|---|---|---|
| 0 | 80 | 3500 | Tim | 2020-10-14 |
| 1 | 20 | 1500 | Jim | 2020-10-15 |
| 2 | 60 | 2000 | Kim | 2020-10-15 |
| 3 | 30 | 1000 | Bim | 2020-10-17 |
| 4 | 50 | 2000 | Dim | 2020-10-14 |
| 5 | 55 | 1500 | Sim | 2020-10-14 |
| 6 | 95 | 4000 | Lim | 2020-10-18 |
Note: In this case, duedate is created as string - which restrict usage of date methods like:
.dt.date
If you try to use them like:
df['duedate'].dt.date
You will get error like:
AttributeError: Can only use .dt accessor with datetimelike values
Step 2: Convert Column to DateTime in Pandas
Next steps is to convert duedate into DateTime column by:
df['duedate'] = pd.to_datetime(df['duedate'])
or giving the format:
df['duedate'] = pd.to_datetime(df['duedate'], format='%d%b%Y:%H:%M:%S.%f')
Step 3: Create new column Day of Week
Once you have DataFrame with correct data and types you can create new column which have date of week based on a date in the same row:
df['day'] = df['duedate'].dt.day_name()
Now DateFrame should look like:
| productivity | salary | person | duedate | day | |
|---|---|---|---|---|---|
| 0 | 80 | 3500 | Tim | 2020-10-14 00:00:00 | Wednesday |
| 1 | 20 | 1500 | Jim | 2020-10-15 00:00:00 | Thursday |
| 2 | 60 | 2000 | Kim | 2020-10-15 00:00:00 | Thursday |
| 3 | 30 | 1000 | Bim | 2020-10-17 00:00:00 | Saturday |
| 4 | 50 | 2000 | Dim | 2020-10-14 00:00:00 | Wednesday |
| 5 | 55 | 1500 | Sim | 2020-10-14 00:00:00 | Wednesday |
| 6 | 95 | 4000 | Lim | 2020-10-18 00:00:00 | Sunday |
Note: If you like to use the number instead of the name of the day you can use:
df['day'] = df['duedate'].dt.weekday
More about date methods: pandas.Series.dt
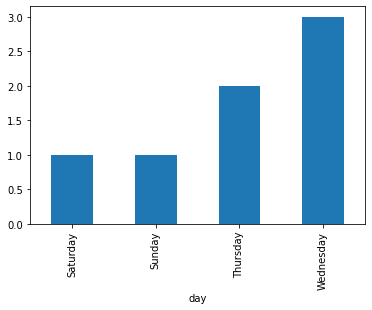
Step 4: Plotting Dates and Bar Plots - day of week
The final step is to plot Bar chart based on day of week by which can be done in Python and Pandas by:
df[['day', 'person']].groupby('day').count().plot(kind='bar', legend=None)
Which looks like to:
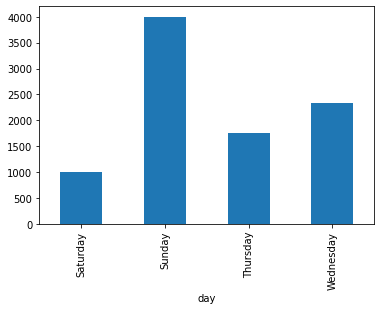
If you like to plot numeric data and use mean or sum instead of count:
df[['day', 'salary']].groupby('day').mean().plot(kind='bar', legend=None)
output:
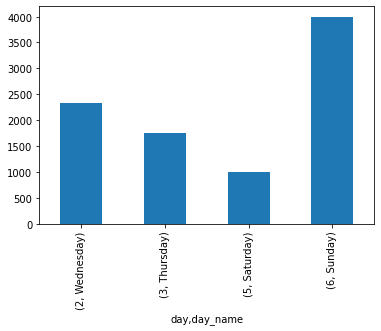
Step 5: Sort Bar Plot Week Days
If you need to sort the week days in bar plot chart in Python like:
- Monday
- Tuesday
- Wednesday
You can do a simple trick:
- convert days to names and numbers
- use both as a index
- sort the index
Below you can find the solution:
df['day'] = df['duedate'].dt.dayofweek
df['day_name'] = df['duedate'].dt.day_name()

df[['day', 'salary', 'day_name']].groupby(['day', 'day_name']).mean().sort_index().plot(kind='bar', legend=None)
The result is bar plot with day of week sorted in natural order: